Performance Overview
Last updated on 2025-11-11 | Edit this page
Overview
Questions
- Is it enough to look at a jobs walltime?
- What steps can I take to evaluate a jobs performance?
- What popular types of reports exist?
Objectives
After completing this episode, participants should be able to …
- Explain different approaches to performance measurements.
- Understand common terms and concepts in performance analyses.
- Create a performance report through a third-party tool.
- Describe what a performance report is meant for (establish baseline, documentation of issues and improvements through optimization, publication of results, finding the next thread to pull in a quest for optimization)
- Measure the performance of central components of underlying hardware (CPU, Memory, I/O, …) (split episode?)
- Identify which general areas of computer hardware may affect performance.
Workflow
- Previously checked scaling behavior by looking at walltime
- what if we would count other things while our job is running? Could
be
- CPU utilization
- FLOPS
- Memory uitilization
- …
- Two possible ways to look at this data with respect to time:
- tracing: over time
- sampling: accumulated results at the end
- Third-party tools to measure these things - you can use them with your jobs
Here you can choose between three alternative perspectives on our job:
- ClusterCockpit: A job monitoring service available on many of our clusters. Needs to be centrally maintained by your HPC administration team.
- Linaro Forge Performance Reports: A commercial application providing a single page performance overview of your job. Your cluster may have licenses available.
- TBD: A free, open source tool/set of tools, to get a general performance overview of your job.
Performance counters and permissions, may require
--exclusive, depends on system! Look at documentation /
talk to your administrators / support.
cap_perfmon,cap_sys_ptrace,cap_syslog=ep
kernel.perf_event_paranoid
Live coding:
- Set up the main tool. How do I access it? How can I use it with my job?
- Run snowman with 8 cores
General report
How Does Performance Relate to Hardware?
(Following this structure throughout the course, trying to understand the performance in these terms)
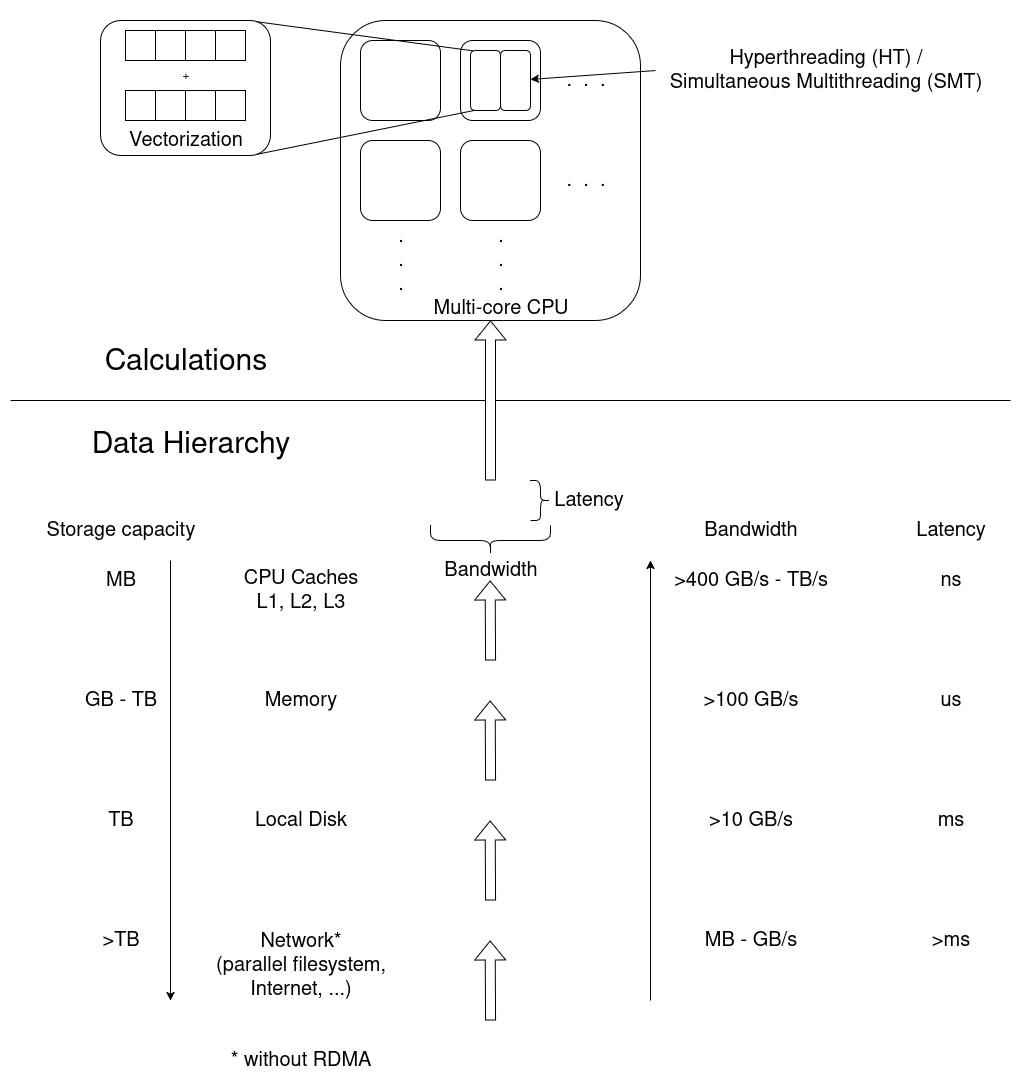
Broad dimensions of performance:
- CPU (Front- and Backend, FLOPS)
- Frontend: decoding instructions, branch prediction, pipeline
- Backend: getting data from memory, cache hierarchy & alignment
- Raw calculations
- Vectorization
- Out-of-order execution
- Accelerators (e.g. GPUs)
- More calculations
- Offloading
- Memory & communication models
- Memory (data hierarchy)
- Working memory, reading data from/to disk
- Bandwidth of data
- I/O (broader data hierarchy: disk, network)
- Stored data
- Local disk (caching)
- Parallel fs (cluster-wide)
- MPI-Communiction
- Parallel timeline (synchronization, etc.)
- Application logic
Exercise: Match application behavior to hardware
Which part of the computer hardware may become an issue for the following application patterns:
- Calculating matrix multiplications
- Reading data from processes on other computers
- Calling many different functions from many equally likely if/else branches
- Writing very large files (TB)
- Comparing many different strings if they match
- Constructing a large simulation model
- Reading thousands of small files for each iteration
Maybe not the best questions, also missing something for accelerators.
- CPU (FLOPS) and/or Parallel timeline
- I/O (network)
- CPU (Front-End)
- I/O (disk)
- (?) CPU-Backend, getting strings through the cache?
- Memory (size)
- I/O (disk)
Summary
- General reports show direction in which to continue
- Specialized tools may be necessary to move on
Leading question: Connection to hardware is quite deep, why does it matter? -> Drill deeper, e.g. on NUMA & pinning
- First things first, second things second, …
- Profiling, tracing
- Sampling, summation
- Different HPC centers may provide different approaches to this workflow
- Performance reports offer more insight into the job and application behavior