Performance Overview
Last updated on 2025-11-11 | Edit this page
Estimated time: 10 minutes
Overview
Questions
- Is it enough to look at a jobs walltime?
- What steps can I take to evaluate a jobs performance?
- What popular types of reports exist?
Objectives
After completing this episode, participants should be able to …
- Explain different approaches to performance measurements.
- Understand common terms and concepts in performance analyses.
- Create a performance report through a third-party tool.
- Describe what a performance report is meant for (establish baseline, documentation of issues and improvements through optimization, publication of results, finding the next thread to pull in a quest for optimization)
- Measure the performance of central components of underlying hardware (CPU, Memory, I/O, …) (split episode?)
- Identify which general areas of computer hardware may affect performance.
Narrative:
- Scaling study, scheduler tools, project proposal is written and handed in
- Maybe I can squeeze out more from my current system by trying to understand better how it behaves
- Another colleague told us about performance measurement tools
- We are learning more about our application
- Aha, there IS room to optimize! Compile with vectorization
What we’re doing here:
- Get a complete picture
- Introduce missing metrics / definitions, and popular representations of data, e.g. Roofline
- Relate to hardware on the same level of detail
Workflow
- Previously checked scaling behavior by looking at walltime
- what if we would count other things while our job is running? Could
be
- CPU utilization
- FLOPS
- Memory uitilization
- …
- Two possible ways to look at this data with respect to time:
- tracing: over time
- sampling: accumulated results at the end
- Third-party tools to measure these things - you can use them with your jobs
We go with three alternatives here, pick one an stick to it throughout your course, but highlight that there are alternatives and learners may not have access to certain tools on any cluster.
Here you can choose between three alternative perspectives on our job:
- ClusterCockpit: A job monitoring service available on many of our clusters. Needs to be centrally maintained by your HPC administration team.
- Linaro Forge Performance Reports: A commercial application providing a single page performance overview of your job. Your cluster may have licenses available.
- TBD: A free, open source tool/set of tools, to get a general performance overview of your job.
Performance counters and permissions, may require
--exclusive, depends on system! Look at documentation /
talk to your administrators / support.
cap_perfmon,cap_sys_ptrace,cap_syslog=ep
kernel.perf_event_paranoid
Live coding:
- Set up the main tool. How do I access it? How can I use it with my job?
- Run snowman with 8 cores
General report
How Does Performance Relate to Hardware?
Introduce hardware on the same level of detail and with the same terms as the performance reports by ClusterCockpit, LinaroForge, etc., as soon as they appear. Only introduce what we need, to avoid info dump. But point to additional information that gives a complete overview -> hpc-wiki!
(Following this structure throughout the course, trying to understand the performance in these terms)
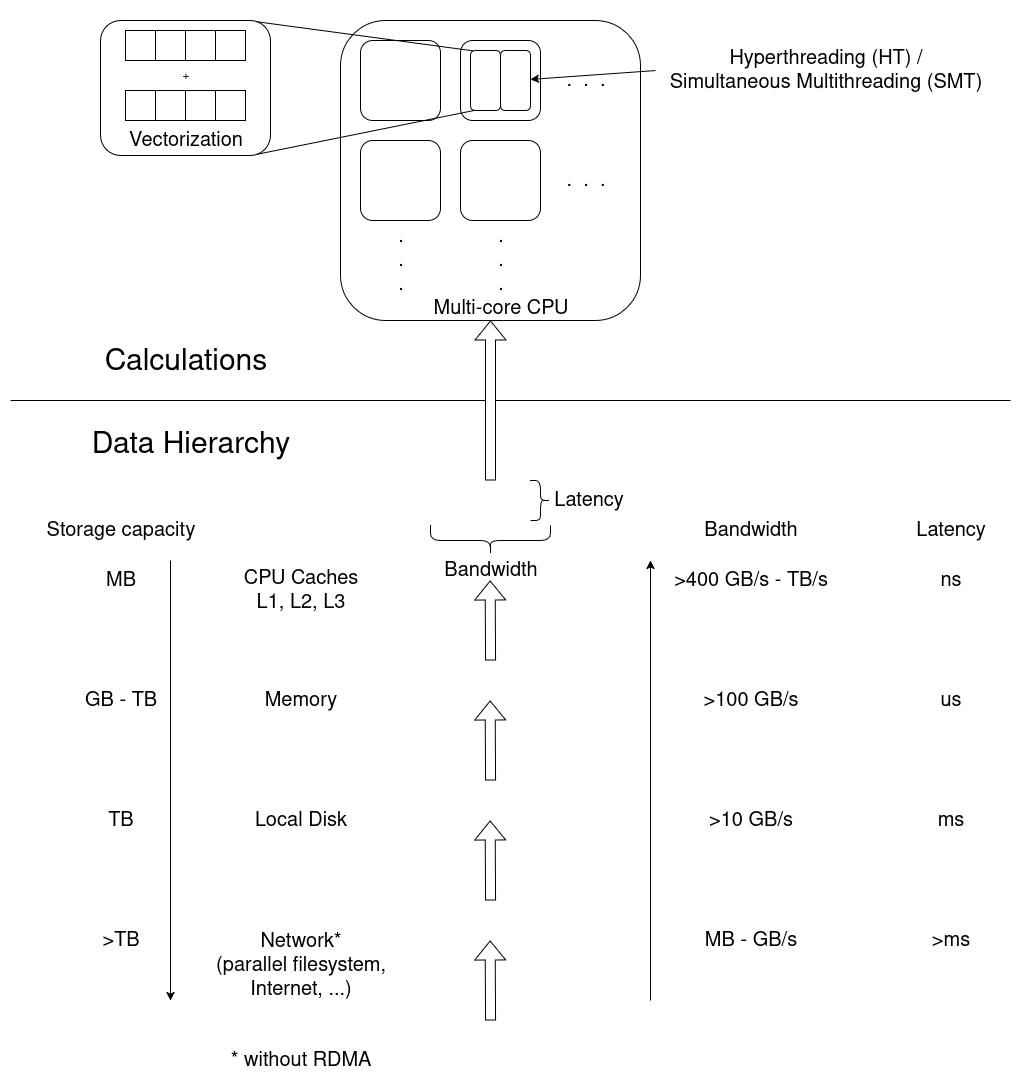
Broad dimensions of performance:
- CPU (Front- and Backend, FLOPS)
- Frontend: decoding instructions, branch prediction, pipeline
- Backend: getting data from memory, cache hierarchy & alignment
- Raw calculations
- Vectorization
- Out-of-order execution
- Accelerators (e.g. GPUs)
- More calculations
- Offloading
- Memory & communication models
- Memory (data hierarchy)
- Working memory, reading data from/to disk
- Bandwidth of data
- I/O (broader data hierarchy: disk, network)
- Stored data
- Local disk (caching)
- Parallel fs (cluster-wide)
- MPI-Communiction
- Parallel timeline (synchronization, etc.)
- Application logic
Maybe we should either focus on components (CPUs, memory, disk, accelerators, network cards) or functional entities (compute, data hierarchy, bandwidth, latency, parallel timelines)
We shouldn’t go into too much detail here. Define broad categories where performance can be good or bad. (calculations, data transfers, application logic, research objective (is the calculation meaningful?))
Reuse categories in the same order and fashion throughout the course, i.e. point out in what area a discovered inefficiency occurs.
Introduce detail about hardware later where it is needed, e.g. NUMA for pinning and hints.
Exercise: Match application behavior to hardware
Which part of the computer hardware may become an issue for the following application patterns:
- Calculating matrix multiplications
- Reading data from processes on other computers
- Calling many different functions from many equally likely if/else branches
- Writing very large files (TB)
- Comparing many different strings if they match
- Constructing a large simulation model
- Reading thousands of small files for each iteration
Maybe not the best questions, also missing something for accelerators.
- CPU (FLOPS) and/or Parallel timeline
- I/O (network)
- CPU (Front-End)
- I/O (disk)
- (?) CPU-Backend, getting strings through the cache?
- Memory (size)
- I/O (disk)
Summary
- General reports show direction in which to continue
- Specialized tools may be necessary to move on
Leading question: Connection to hardware is quite deep, why does it matter? -> Drill deeper, e.g. on NUMA & pinning
- First things first, second things second, …
- Profiling, tracing
- Sampling, summation
- Different HPC centers may provide different approaches to this workflow
- Performance reports offer more insight into the job and application behavior